
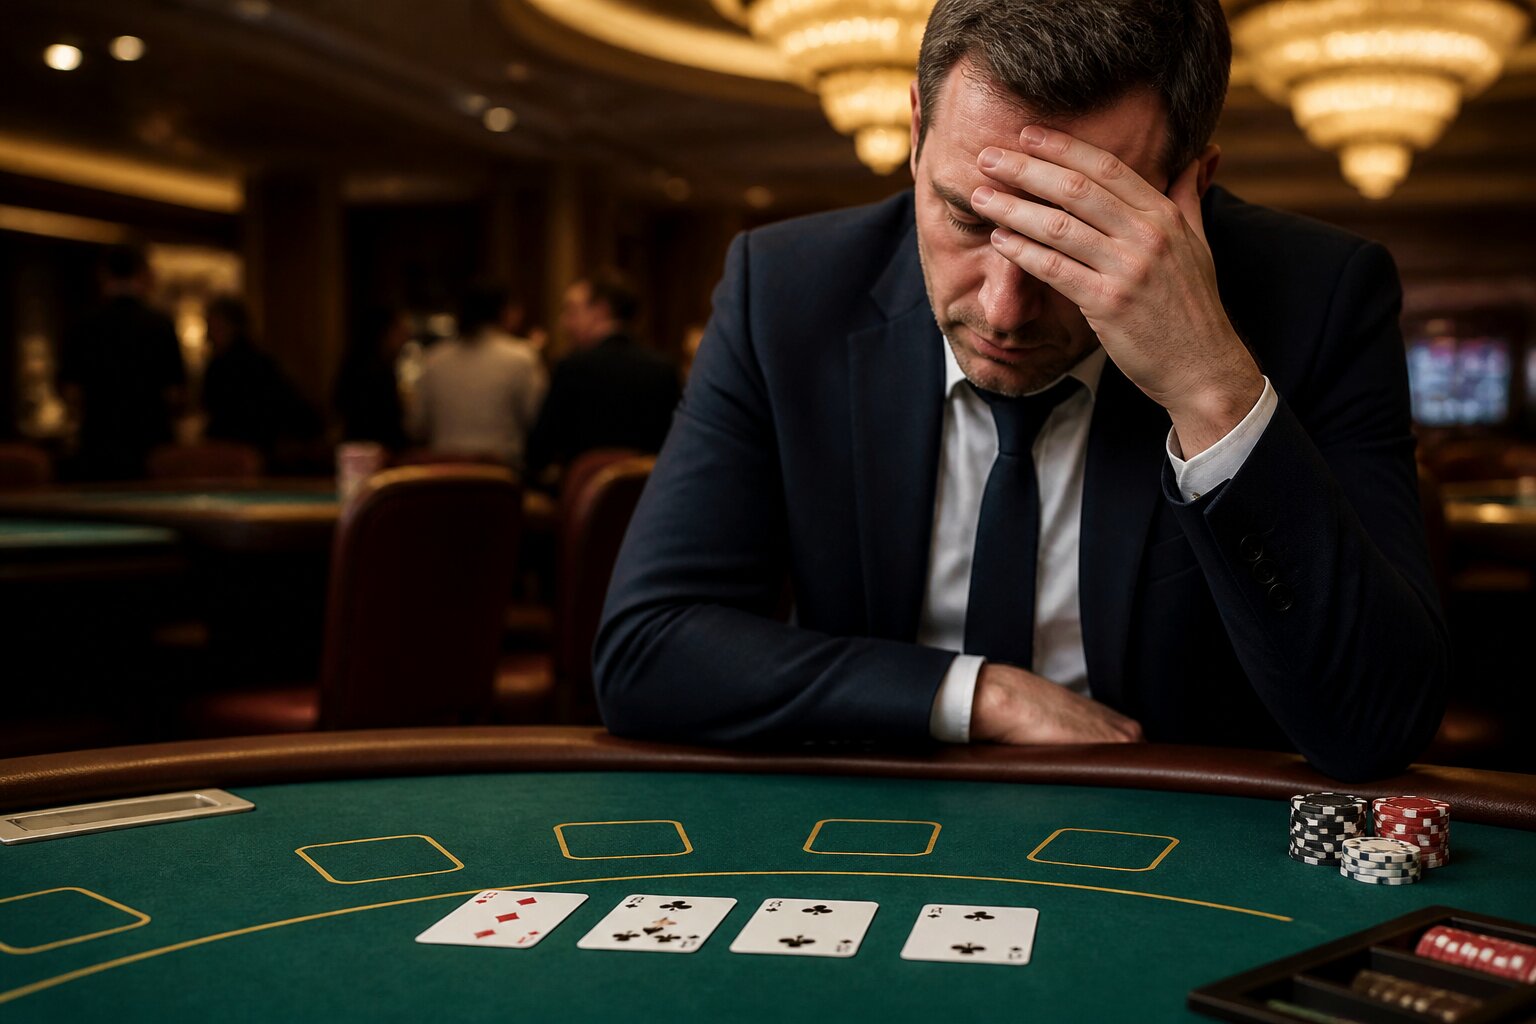
Ever sat at the blackjack table and wondered how likely a losing streak is? It can feel frustrating when defeats follow one another, but the numbers behind those runs are clear and can change how you think about sessions.
Understanding these probabilities helps with sensible money management and keeps play focused on the maths rather than the emotion. Read on to see what the numbers actually mean and how they compare with other casino games.
Understanding Probability in Blackjack
Probability is the measure of how likely an outcome is to occur. In blackjack, each hand is an independent event: the result of one hand does not change the underlying odds for the next. The chances for any single hand are determined by the game rules and the number of decks in play.
Typical single-hand win rates for players lie roughly between 42% and 49%, depending on rule variations such as dealer behaviour and payout for a natural blackjack. The chance of losing a hand commonly sits around 48–49%, and pushes (ties) occur in the small remainder of hands. These percentages are averages across many hands and don’t guarantee what will happen in any short sequence.
Because every deal is independent, short-term patterns — whether many wins or many losses — are just statistical outcomes within those fixed probabilities. Understanding this sets the scene for calculating the exact odds of consecutive losses, which is what the next section explains.
How Likely Are You to Lose Consecutive Blackjack Hands?
You can calculate the chance of a losing streak by multiplying the single-hand losing probability by itself for as many hands as you want. This uses the rule for independent events, so it assumes each hand has the same chance of losing and that previous outcomes do not change the next one. In practice the exact single-hand loss probability can vary with rules, number of decks and the strategy you use, so 0.49 is an approximate, illustrative figure rather than an exact universal constant.
- Two losing hands in a row: 0.49 × 0.49 = 0.2401, or about 24%.
- Three in a row: 0.49³ ≈ 11.76%.
- Four in a row: 0.49⁴ ≈ 5.76%.
- Five in a row: 0.49⁵ ≈ 2.82%.
Those percentages fall rapidly as the streak lengthens, yet small runs are common in real sessions and should be expected. Over the course of many hands you will experience variance, so occasional short losing streaks are a normal part of play rather than a sign that something is wrong.
Knowing the likelihood of these sequences can help with bankroll planning and temper expectations during play. It is sensible to set loss limits and play within them, and to remember that probabilities give no guarantee about any particular session. If you choose to gamble, do so responsibly.
Key Factors That Affect Your Chances
Several elements change the single-hand probabilities that feed into streak calculations. These do not dictate a particular short-term result, but they do influence long-term averages and the frequency of runs. Understanding these factors helps explain why outcomes differ between sessions and why some tables feel hotter or colder than others.
House Edge and Rules
Different rule sets affect the house advantage. For example, a table paying 3:2 for a natural blackjack gives a better expected return for the player than one that pays 6:5. Other rule details — whether the dealer hits soft 17, whether doubling after split is allowed, and surrender options — also shift the house edge and therefore the balance of wins and losses over many hands.
Small rule changes can have a surprisingly large cumulative effect. Over thousands of hands, even a fraction of a percent in house edge will change how often you see extended losing or winning runs. Players should be aware that rules shape expectations over the long term, but they do not determine outcomes of individual hands.
The Number of Decks Used
Single-deck games typically produce slightly better odds for the player than multi-deck games because certain combinations (notably naturals) are more likely with fewer cards. As the number of decks increases the house edge usually rises a little, which marginally changes the probability of long losing sequences.
The difference is subtle on a hand-by-hand basis, yet it adds up. With more decks in play, the chance of specific card sequences that favour the player decreases, which affects the expected frequency of streaks when you look at many hands. This is one reason why some players prefer games with fewer decks when available.
Impact of Skill Versus Random Variation
Using basic strategy reduces the house edge compared with making inconsistent decisions. Skill shifts long-term averages but cannot alter the independent probability of any one hand. Strategy improves expected returns over many hands, yet streaks of wins or losses will still occur because of the random nature of individual deals.
In practice this means that a knowledgeable player will lose less on average than a novice over a large number of hands, but that player remains just as likely to encounter a sudden short-term run of losses. Skill smooths the curve over time, it does not switch off the role of chance in the short term.
These technical factors explain why odds vary between tables and sessions, and they lead naturally into common misunderstandings about how probability works in play. Keeping expectations realistic and understanding variance are important parts of responsible play.
Common Misconceptions About Blackjack Probabilities
Several persistent myths cause gamblers to misread outcomes and make poor choices. Clarifying them helps avoid chasing mistaken ideas.
The Gambler’s Fallacy: The idea that a loss streak makes a win “due” misunderstands independence of events; the probability for the next hand remains the same regardless of past results.
Perceived Streak Patterns: Players often see sequences and assume they indicate a pattern to exploit. In properly shuffled play, observed streaks are coincidences consistent with the underlying probabilities rather than signals of an exploitable trend.
Searching for Predictable Patterns: Attempts to find reliable patterns in deal sequences ignore the randomised nature of the shuffle. No pattern can guarantee an advantage unless the shuffle or dealing process is shown to be biased.
Clearing up these misconceptions helps maintain realistic expectations and supports clearer decisions about stakes and session length. The following section shows the numbers in action so the ideas above become concrete.
Practical Examples: Losing Streak Probability Calculations
Concrete calculations make the abstract ideas above easier to grasp. Using 49% as the single-hand losing probability demonstrates how the chance of a streak drops as it lengthens. Showing the maths for a few specific lengths helps put short-term runs into perspective and prevents overreacting to a sequence of losses.
Calculating small streaks:
- Two losses: 0.49 × 0.49 = 0.2401 (about 24.01%).
- Three losses: 0.49³ ≈ 11.76%.
Larger streaks:
- Six losses: 0.49⁶ ≈ 4.9%.
- Nine losses: 0.49⁹ ≈ 0.187%.
These figures show that short streaks are an expected part of play, while very long streaks become increasingly rare. Interpreting these numbers can help you decide how conservative to be with session sizing and how to respond emotionally when a run happens, without suggesting specific staking levels or financial advice.
Always remember that gambling should be for entertainment and carries risk. If you find play is causing harm or distress, seek help and consider setting limits or taking a break.
How Does Losing Streak Probability Compare With Other Casino Games?
Different games have different single-round loss probabilities, so the chance of consecutive losses varies across them. Below are representative figures for losing three rounds in a row in blackjack, roulette (red/black, single zero), and baccarat (banker bet). The comparison clarifies how house edge and game rules affect streaks.
| Game | Chance of Losing One Round | Chance of 3 Losses in a Row |
|---|---|---|
| Blackjack | 49% | 11.76% |
| Roulette (red/black, single zero) | 52.7% | 14.65% |
| Baccarat (Banker) | 50.7% | 13.02% |
This table shows that games with higher single-round loss probabilities produce higher risks of consecutive losses. That difference affects strategic choices about which games to play and how to size bets.
Approach all casino games with an awareness of these probabilities and set limits that fit your budget and aims. If you want guidance on rules or strategies for different tables, our site has detailed game guides and comparisons to help you choose a format that suits your style.
Explore Casino Games at Star Slots
Settle in and enjoy the relaxed atmosphere we offer at Star Slots, where you can unwind and explore a range of casino entertainment at your own pace. We welcome everyone who’s looking for a friendly place to play and have a bit of fun.
**The information provided in this blog is intended for educational purposes and should not be construed as betting advice or a guarantee of success. Always gamble responsibly.